S&P Daily Risk Signatures Guide Me
Match daily metrics to historically similar days & see tomorrow's risk/return profile..
This is my first Substack article, so let me introduce myself. My small LLC is RiskCentrix; I focus on risk assessments. I’ve run a pay service called EZV Algorithms on Seeking Alpha for almost 6 years, and over that time risk signals reduced worst drawdowns by 70%, and by building on the unimpaired positions, substantially accelerated S&P returns.
This is my ‘retirement career’. I ran a quantitative-finance consulting group for about 15 years before deciding on quasi retirement; in that consulting role, working for some of the largest energy users in the USA, we managed risk exposures using swaps and derivatives. My forte has always been the ability to explain difficult concepts in understandable terms, and that put me on the executive risk management committee of various firms. Today, I write for you, and today we’ll discuss how S&P risk assessments can dramatically improve investment performance. Those assessments come in the form of an algorithm which provides daily signals at the opening of each trading day.
In a few minutes you’ll see how the 10-year risk profile of S&P investments, 11% compound annual returns with a worst drawdown (peak-to-trough decline) of 34% can be improved dramatically. I’ll show an algorithm that triples returns and cuts the worst drawdown by 70%. The algorithm identifies daily risk signatures and compares each day’s signature to comparable days from a large historical sample. Then, by examining the next-day returns for those comparable days a risk profile can be inferred and positions modulated accordingly.
The algorithm's premise is that each day carries a risk signature, and every new day can be compared to the risk signatures of 3,000-plus historical risk signatures. There are just a few factors that define a daily risk signature; the most important one is the difference between VIX9D and VIX. If you’re not familiar with those symbols, the VIX is a CBOE index which measures implied volatilities of S&P options. VIX looks at options of about 30-day tenor while VIX9D measures 9-day tenors. Without going into heavy theory, option prices rise with risk perceptions and the measure of those perceptions is the ‘implied’ volatility under the Black Scholes construct.
There is a classic concept in risk theory which says that risk is more dramatically manifest in near-term stresses whereas longer-term perceptions gravitate toward normalcy. You’ll know this from everyday life where you’ll stress over tomorrow’s issue but assume next year will be more normal. But it’s quantifiable in financial instruments. Market volatility might cause gyrations in near-term gains and losses, but long-term returns are fairly predictable.
Consider how this can be exploited in terms of the two VIX symbols. When risk is increasing, 9-day implied volatilities ("IVs") jump more than 30-day IVs so risk conditions can be calibrated based on the how VIX9D exceeds the VIX or not, and the recent trend of those differences can gauge emerging risk conditions. These are the main factors in assessing daily risk. Other factors comprising the daily risk signatures include interactive relationships of S&P trends and S&P observed volatility.
I've built a library of 3,000-plus daily risk signatures, and now as each day emerges, its risk signature can be matched to similar signatures in that library. It's then a simple matter to assess the S&P's next-day return for those comparable days. Strong comparable returns indicate safety while weak ones indicate risk. The objective is making good decisions with your portfolio and that requires establishing triggers that add to or reduce positions depending on conditions. Decision triggers are calibrated based on those comparable next-day returns.
Daily signals are valid at the market open which allows option transactions along with underlying trades. Signals come in progressive forms, ramping up from Out-Add-Max-Hold, and down from Max-Hold-Reduce-Sell. The intermediate Add and Reduce positions are calibrated to balance whipsaw mitigation with other performance measures.
I produce a daily dashboard that governs decisions. To illustrate, the June 24th dashboard is pictured below.
Each day’s dashboard tracks the last 20 days of signals along with return-and-drawdown results over various lookback horizons. Prior to the market opening, the signal is “Pending” then sometime between 9:30 and 10:00 AM eastern time when the VIX quotes open, the final daily signal is validated.
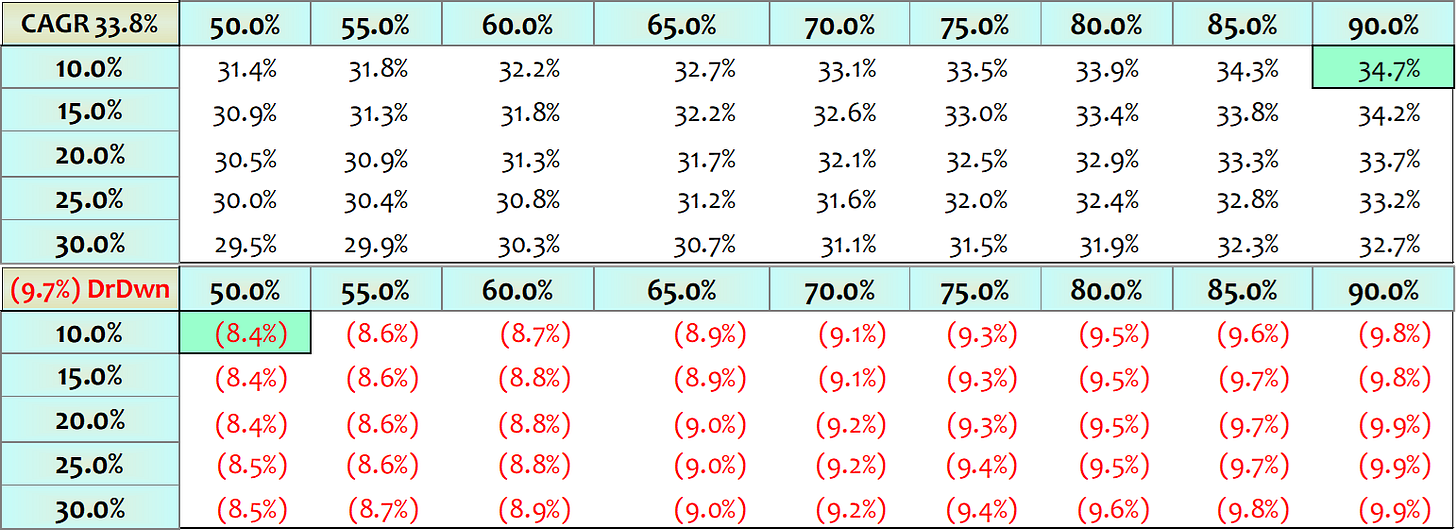
One more thing. Scrutinize the dashboard and you’ll see that ‘Add’ and ‘Reduce’ signals produce holding ratios of 85% and 15% respectively. Those ratios can be adjusted; small sacrifices in CAGR and drawdown performance reduce occasional whipsaw events. Nothing is perfect; markets can move against a signal sometimes and selling everything before a 1% up day carries emotional baggage. Over time the effect is not a big one, but occasional frustrations sap confidence in the system.
This is a matrix of how changes in those single-day 85% and 15% ratios impact long-term performance - alternative Add ratios on the top rows and Reduce ratios on the columns.
Housekeeping & Opportunity
I’ll be terminating my Seeking Alpha (“SA”) service on July 1st, bringing most members along; without going into detail, SA has imposed too many unilateral changes in terms, conditions and revenue sharing for my liking. For continuity, I will be providing existing SA members temporary free access to the dashboards until I settle into a new structure for my pay service. I’d be happy to extend that temporary freebee to Substack readers; just subscribe below or send an email to gettingsm@riskcentrix.com under the precise subject heading ‘Substack Reader’. I hope to see you again soon.


the dashboard says SP bought 622.45 which was the open. AT 9:48 it was 623.75 but no signal came out at that time. 10am when I first saw the dashboard shift from pending to add it was 624.27. All are a big difference does the dashboard reflect actual fills or are just made up?
Does anybody know when the new Risk Signature dashboard resolves in the AM? Last two days before the open and after there’s been a pending buy signal, and then it has resolved to OUT at some point. I haven’t pegged it yet. I’m also wondering how the returns model deals with not going on opening/closing values, since there’s often so much price volatility in the first half hour of open….